The Project
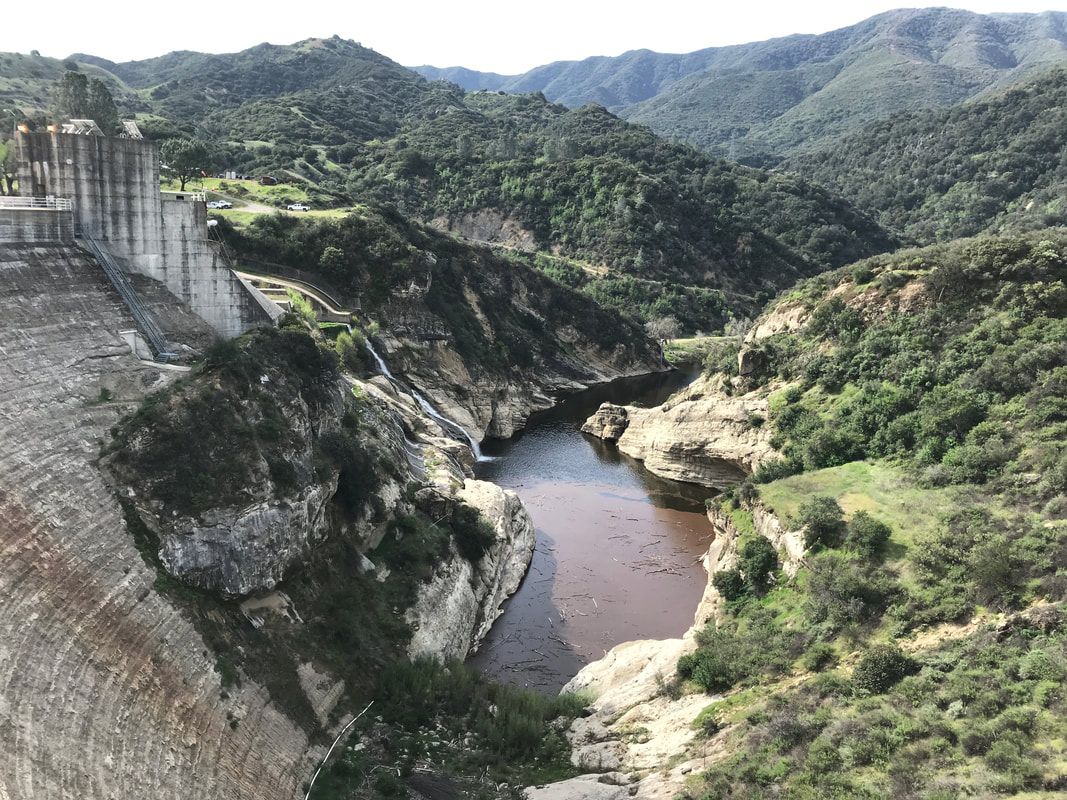
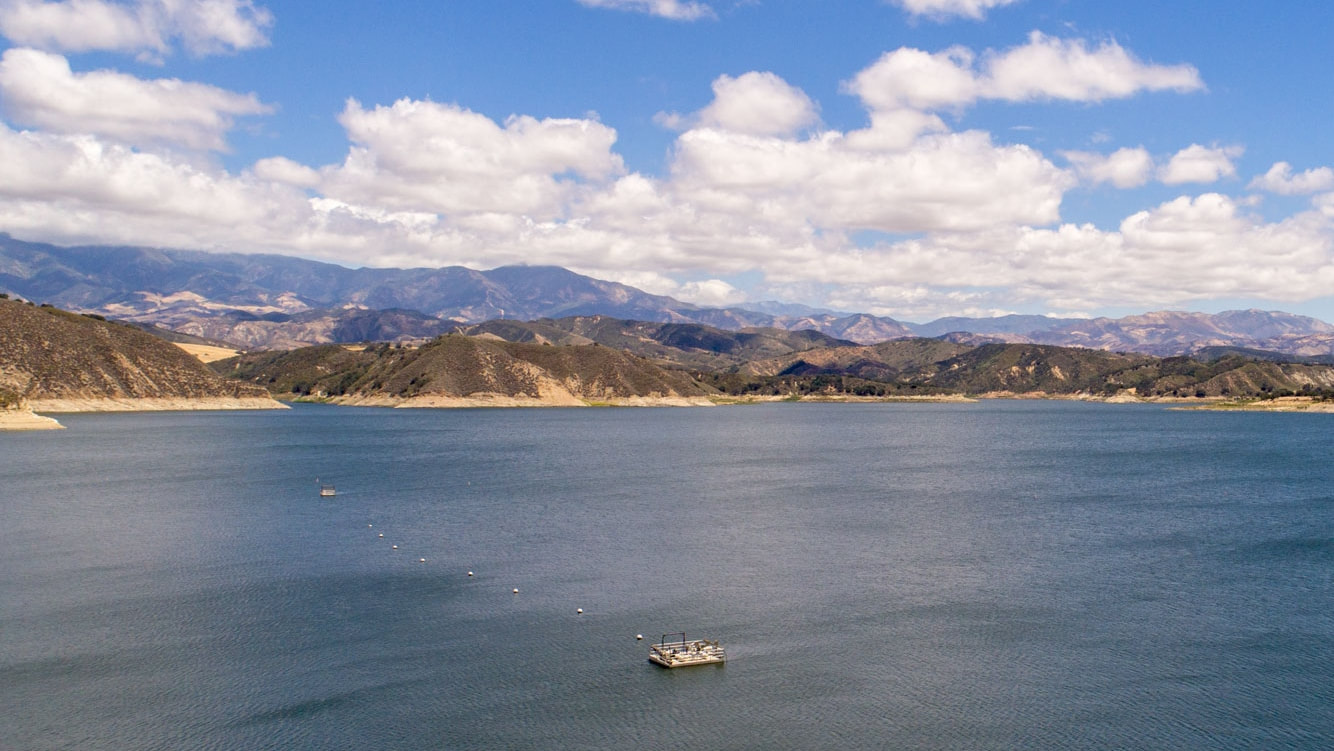
The City of Santa Barbara relies on local surface water from Lake Cachuma and Gibraltar Reservoir, located in the Santa Ynez River watershed. The City is interested in understanding potential impacts of climate change on water held in these reservoirs to help inform the Long Term Water Supply Plan with a time horizon out to 2050. This analysis provides a range of potential variations in streamflow for the Santa Ynez River watershed, and therefore inflow to the reservoirs, from 2020 to 2058.
The Objectives
|
|
Modeling Approach
|
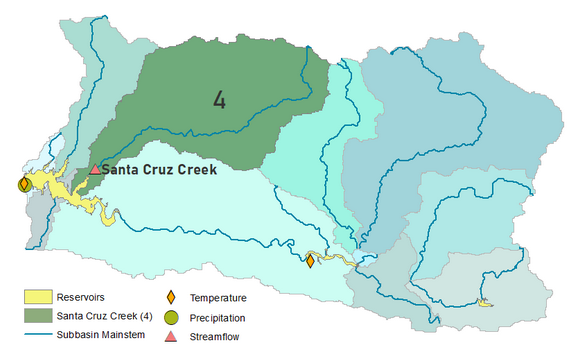
The Soil & Water Assessment Tool is used here to model potential impacts of climate change on upper Santa Ynez River watershed streamflow. The model was set up using historical precipitation and temperature measurements from 1980 to 2018. To determine how accurately the model reflected Santa Ynez River watershed streamflow, simulated and historical streamflow was compared for Santa Cruz Creek, a tributary that discharges directly into Lake Cachuma (right).
|
|
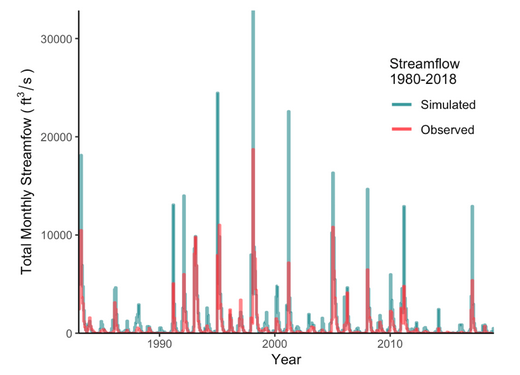
The model was adjusted to simulate streamflow in line with Santa Cruz Creek hydrology. While simulated was consistently higher than observed streamflow, the model correctly predicted the timing of storm flows (left). This alignment indicates the model appropriately reflects hydrologic processes in the Santa Cruz Creek watershed. With the ability to replicate Santa Cruz Creek flows relatively well, changes to temperature and precipitation could then be incorporated to simulate the range of potential impacts to streamflow from climate change.
Climate Change
Five different climate models from Cal-Adapt, a climate data platform and adaptation planning tool, are used to represent the range of possible conditions for the high-emissions scenario (RCP 8.5) for 2020 - 2058. The following scenarios are represented in this analysis:
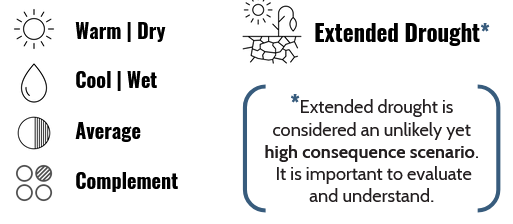
The complement scenario is unique as it is unlike the warm/dry, cool/wet, and average scenarios. The complement scenario was used to ensure the best coverage of different possibilities, while the extended drought scenario is a early century dry spell from 2023 to 2042.
Results
Seasonality
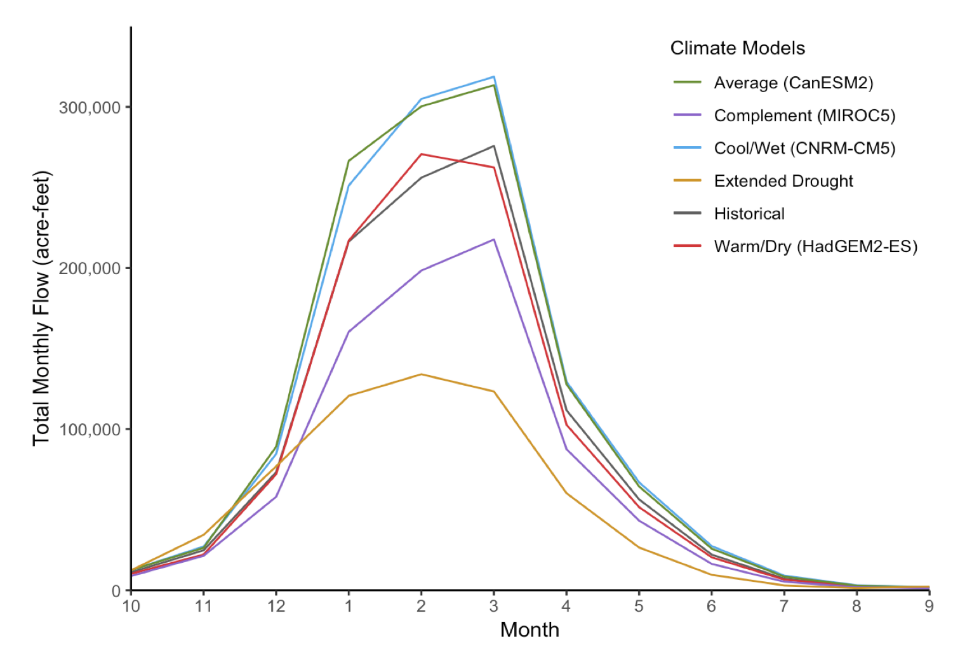
The timing of streamflow has important implications for water availability throughout the year. The climate models used in this analysis project both increases and decreases in monthly streamflow as well as potential shifts in the timing of streamflow. The cool/wet and average models project increases in streamflow, while the complement and drought models project a decrease in streamflow. The extended drought model projects a slight increase in streamflow during the fall and early winter and the largest decrease in total streamflow of all the models during the winter and spring months.
Streamflow
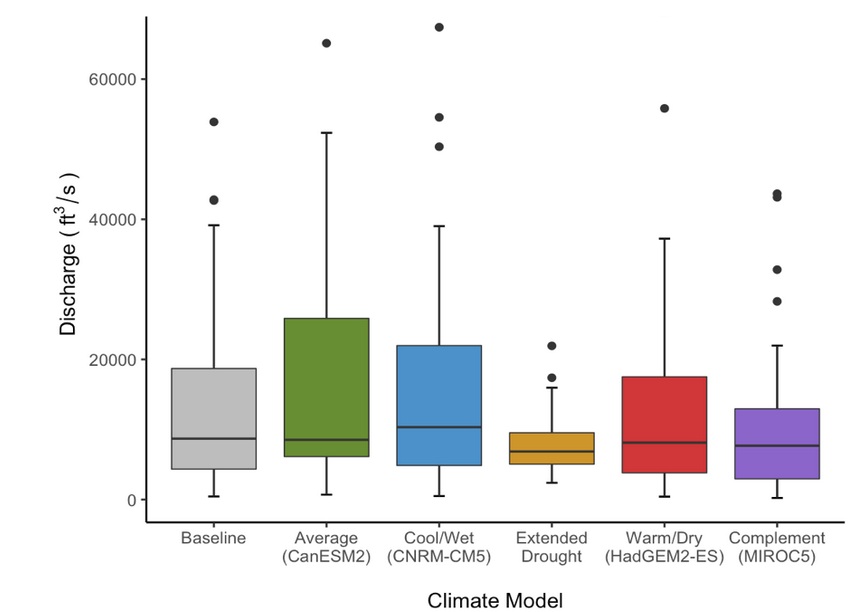
Projected changes in streamflow from 2020 to 2058 indicate a wide range of possibilities. The extended drought model projects the lowest median discharge (6,860 ft3/s) and a ~40% reduction from the historical baseline. The cool/wet model projects the highest median (10,327 ft3/s) and a ~20% increase from the historical baseline. Additionally, the drought model displays the least amount of variation in streamflow.
Inflow
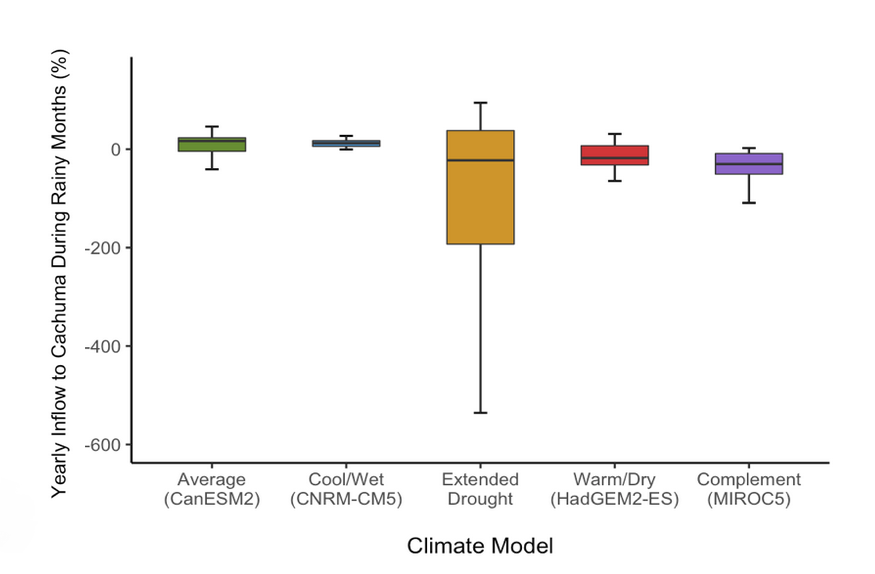
This analysis estimated potential upper Santa Ynez River inflows to Lake Cachuma under different climate scenarios. Considering the 25th percentile, or boxplot lower borders, the extended drought model projects up to a 200% reduction in streamflow contribution to Lake Cachuma. The other models project a potential increase of streamflow contribution ranging from 0 to 20%. This extreme range of possible futures is representative of the uncertainties presented by climate change and its localized impacts.
Conclusion
Climate change impacts to Santa Ynez River watershed streamflow are variable. Understanding implications of an extended drought will help the City of Santa Barbara strategize use of their diverse water supply sources. The following are the main takeaways from the project:
- Preparing for potential reservoir supply limitations and increased future demand, necessitates flexibility in the water portfolio.
- The non-drought climate models anticipate a wide range of average yearly streamflow from -40% to +20% compared to historical flows.
- The drought model indicates average streamflow contribution to Lake Cachuma could decrease by two-fold.
Sedimentation
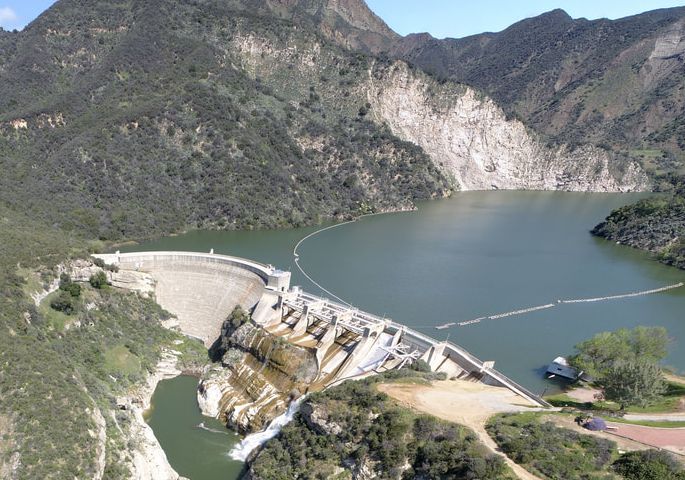
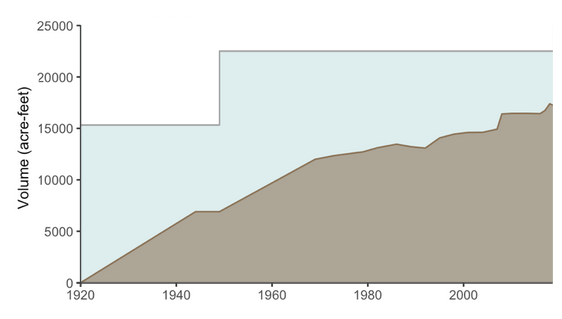
Gibraltar Reservoir has acted as a sediment trap in the upper Santa Ynez River watershed for nearly 100 years. The figure (below) shows the historical sedimentation in brown and water storage in blue, illustrating decreasing water capacity in Gibraltar Reservoir. The solid grey line indicates the total capacity of the reservoir from 1920 to 2019. As water storage capacity reaches 0, downstream Cachuma Reservoir may experience increased sedimentation.
|
|
Additional Resources
If you would like to learn more about the project links have been provided below to our policy brief, poster, and final report.


Acknowledgements
This project could have not have happen without the continued help and expertise from our faculty advisors Arturo Keller and John Melack. We would also like to extend a deep gratitude and appreciation to our external advisors and Bren faculty for the additional guidance throughout the project.
